


August 2026
As the 10-year Treasury pushes toward 4.75% for the first time since January 2025, investors are asking what it means for U.S. commercial real estate (CRE). Importantly, the reason rates are rising matters as much as the level. What began as an orderly move in real rates and term premium is now giving way to something less benign - rising inflation expectations and a bond market that’s testing the Fed's resolve. A 10-year yield near 5% raises the bar for CRE, but it sharpens our thesis rather than breaks it: net operating income (NOI) growth and selectivity are what will likely separate winners from the rest.
Why are 10-year Treasury rates rising?
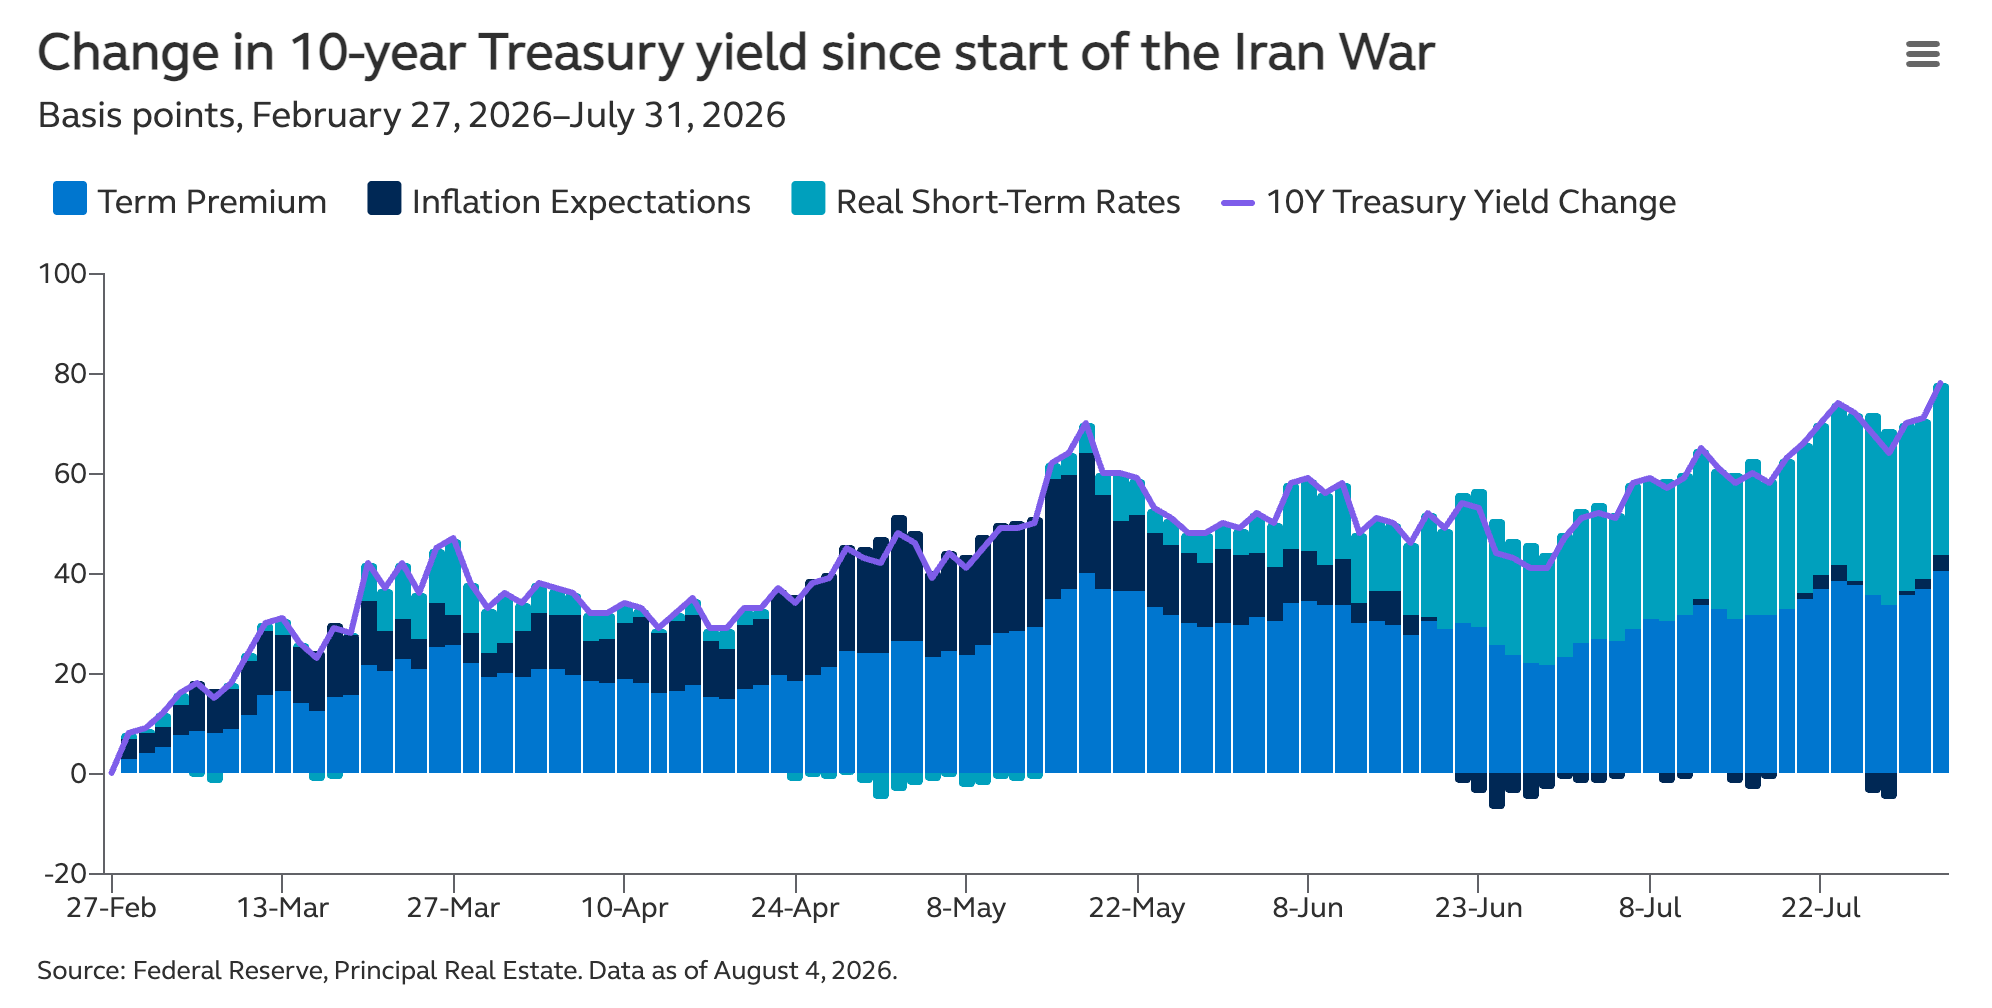
The starting point is understanding why longer-term rates are rising. Thinking of the 10-year Treasury as the sum of three building blocks: the neutral rate (R*), inflation expectations, and the term premium, expectations for each have changed significantly since the start of the conflict in Iran. Through mid-July, inflation expectations were well contained, with the rise in Treasury rates driven by a +32bp increase in the 10-year term premia and +27bp increase in implied real short-term rates. However, in the last two weeks of July, inflation expectations began to rise alongside continued increases in real rates and term premia. This accelerated after the July FOMC meeting, signaling growing concern that Fed Chair Kevin Warsh may prove unwilling to act aggressively enough should inflation remain elevated. Effectively, the bond market is testing the Fed's credibility.
 |
What does this mean for headline CRE metrics?
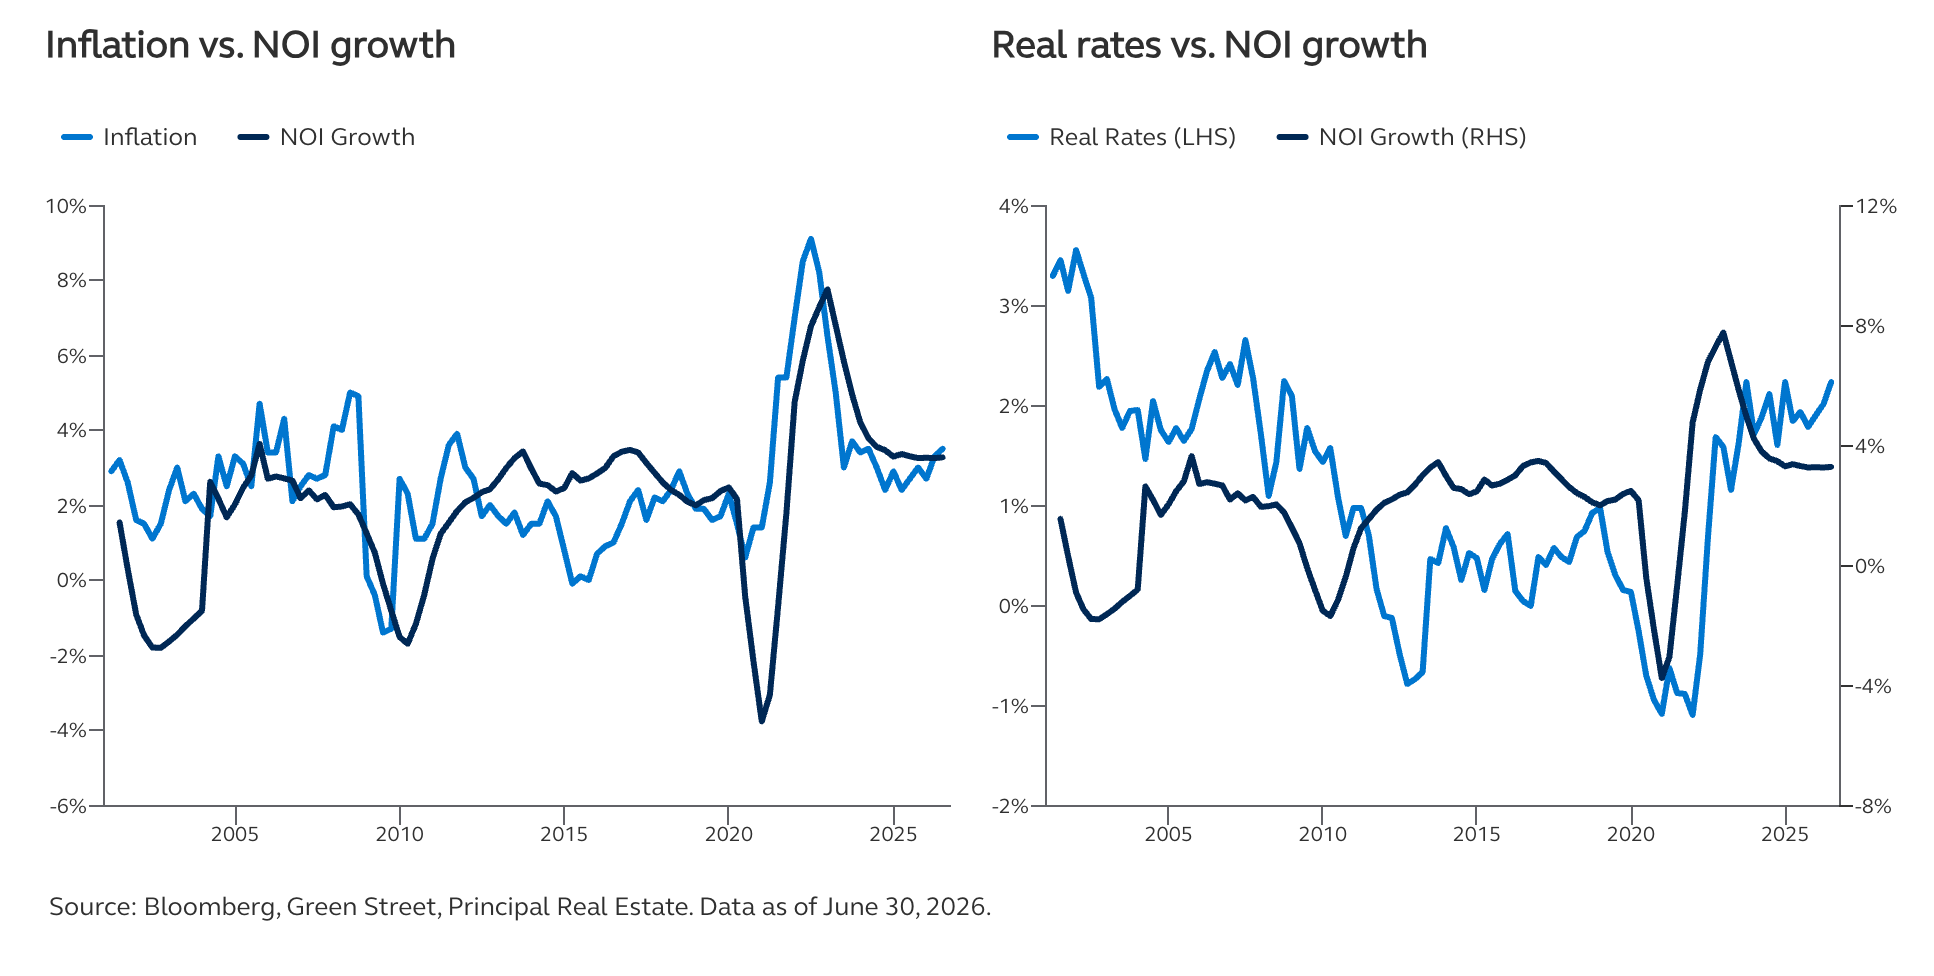
We've long argued that stability in interest rates is the key for CRE—a ~4.5% rate with 3% inflation implies a 1.5% real rate, an accommodative backdrop. But a 10-year approaching 5% is a psychologically and mechanically important line. Average 5-year NOI growth forecasts of ~3.4% across property types are insufficient to defend value against a higher discount rate and rising financing costs. The result is a wider bid/ask spread, slower price discovery, and frozen transaction volumes. Entity- and portfolio-level sales may prove more resilient, however, as stronger-capitalized buyers move to take advantage of any weakness.
CRE is historically a hedge against inflation, but stagflation (rising rates & slowing growth) threw a wrench into the equiation
 |
Maximizing NOI growth becomes even more important
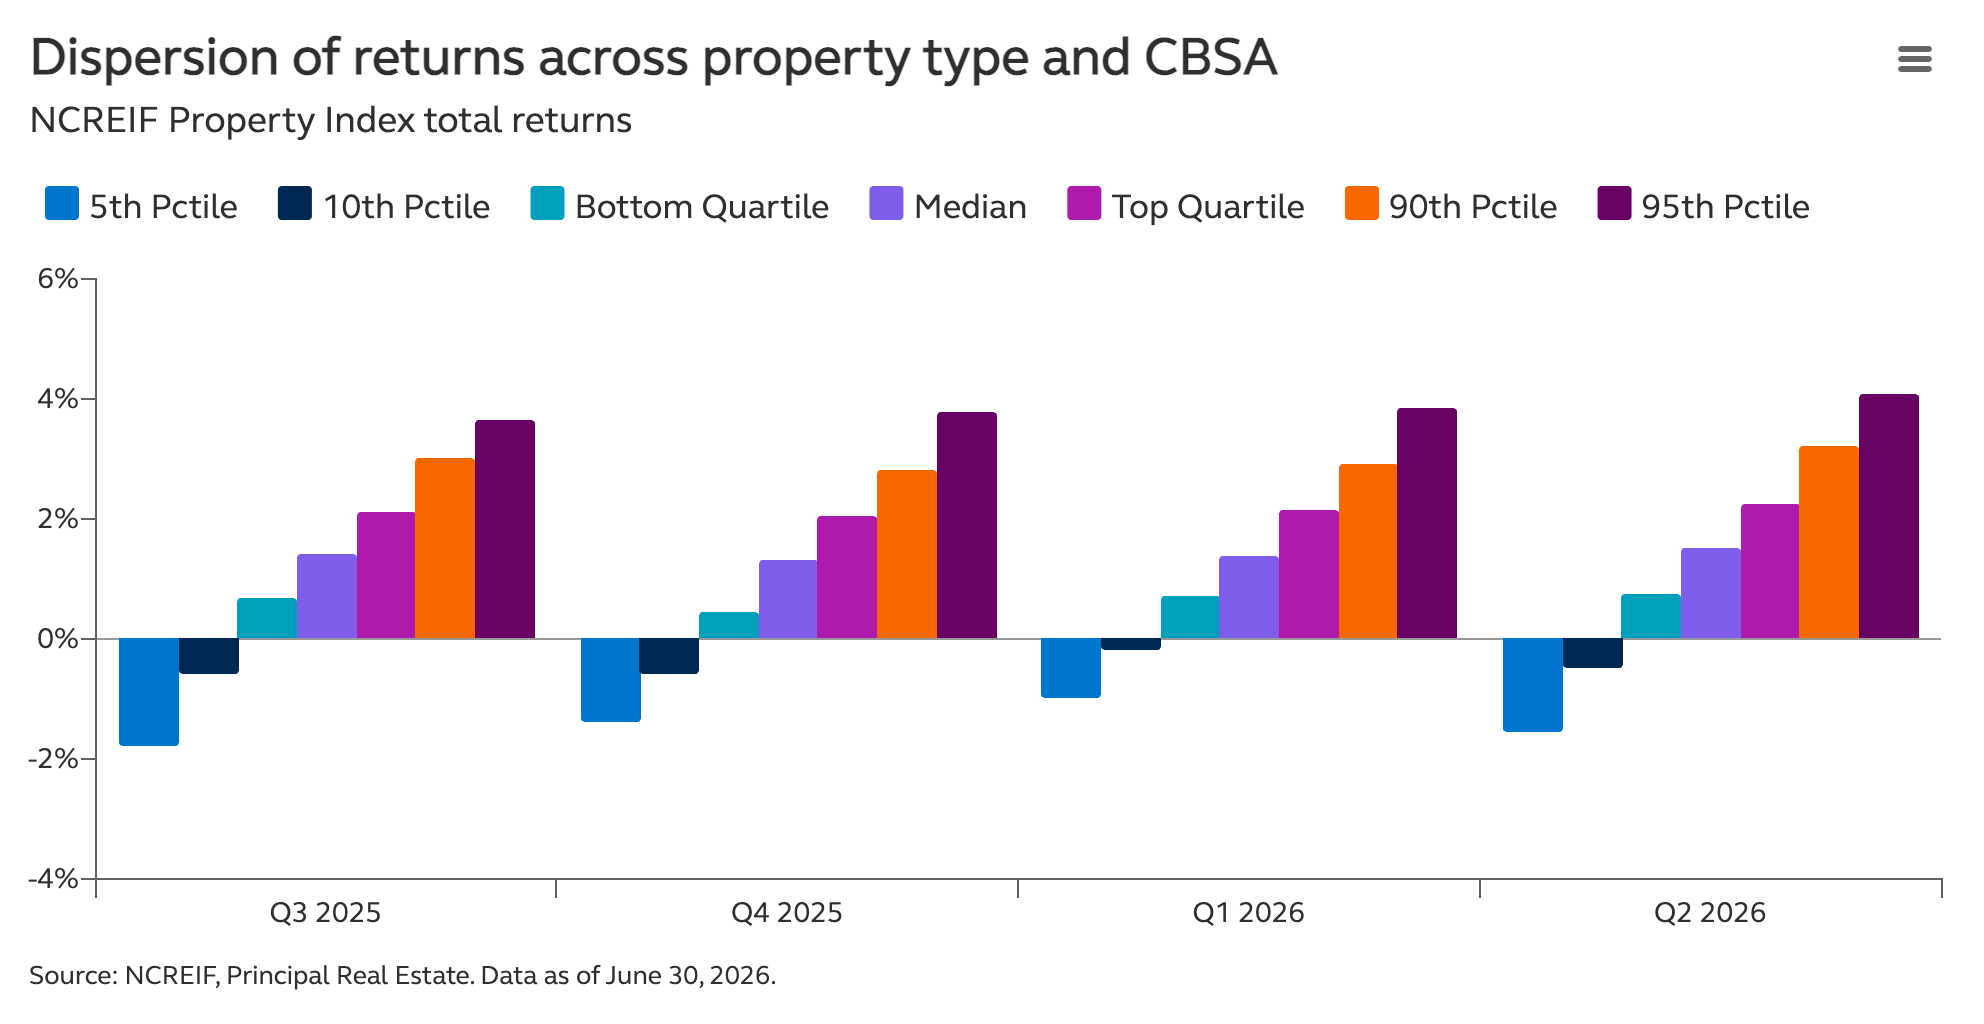
We've also long argued that NOI growth is the key to total returns—it drives both income and capital returns in a world with little cap rate compression. This becomes even more critical as the 10-year approaches 5% and dispersion across property types, markets, and fund vehicles widens. The cohort producing the strongest NOI growth should be able to absorb higher rates—the rest will likely face valuation headwinds. Investors are likely underappreciating the growth profile of the top half, and especially the top quartile, of the NCREIF Property Index (NPI). While the NPI returned a modest 1.29% QoQ in 2Q26, the top quartile has produced greater than 2% quarterly returns (~8% annualized) for four consecutive quarters. Bottom line, we are doubling down on our cycle for selectivity thesis in a higher interest rate environment.
 |
Our longer-term views are not derailed
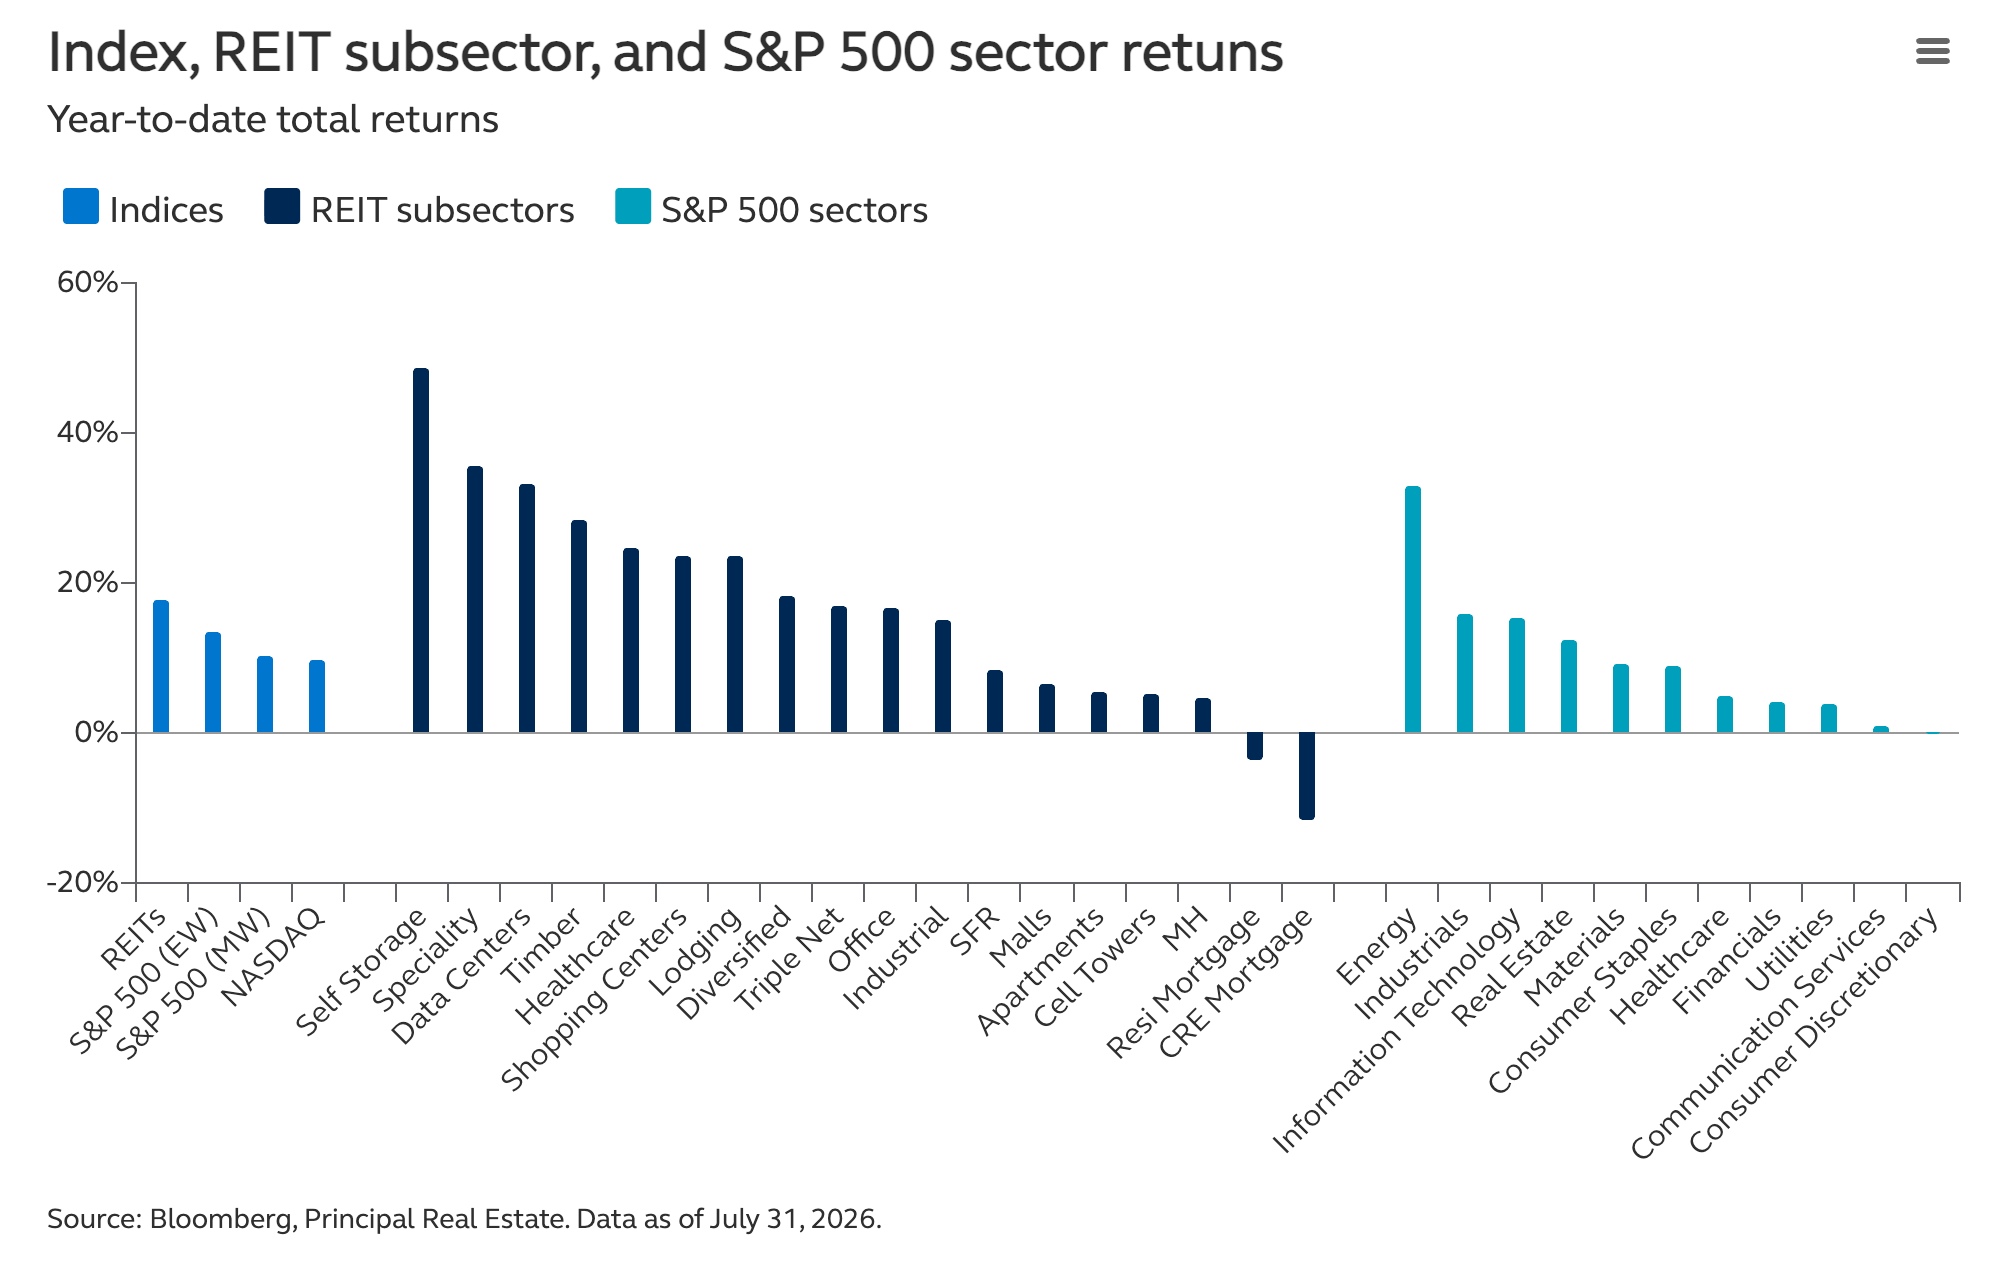
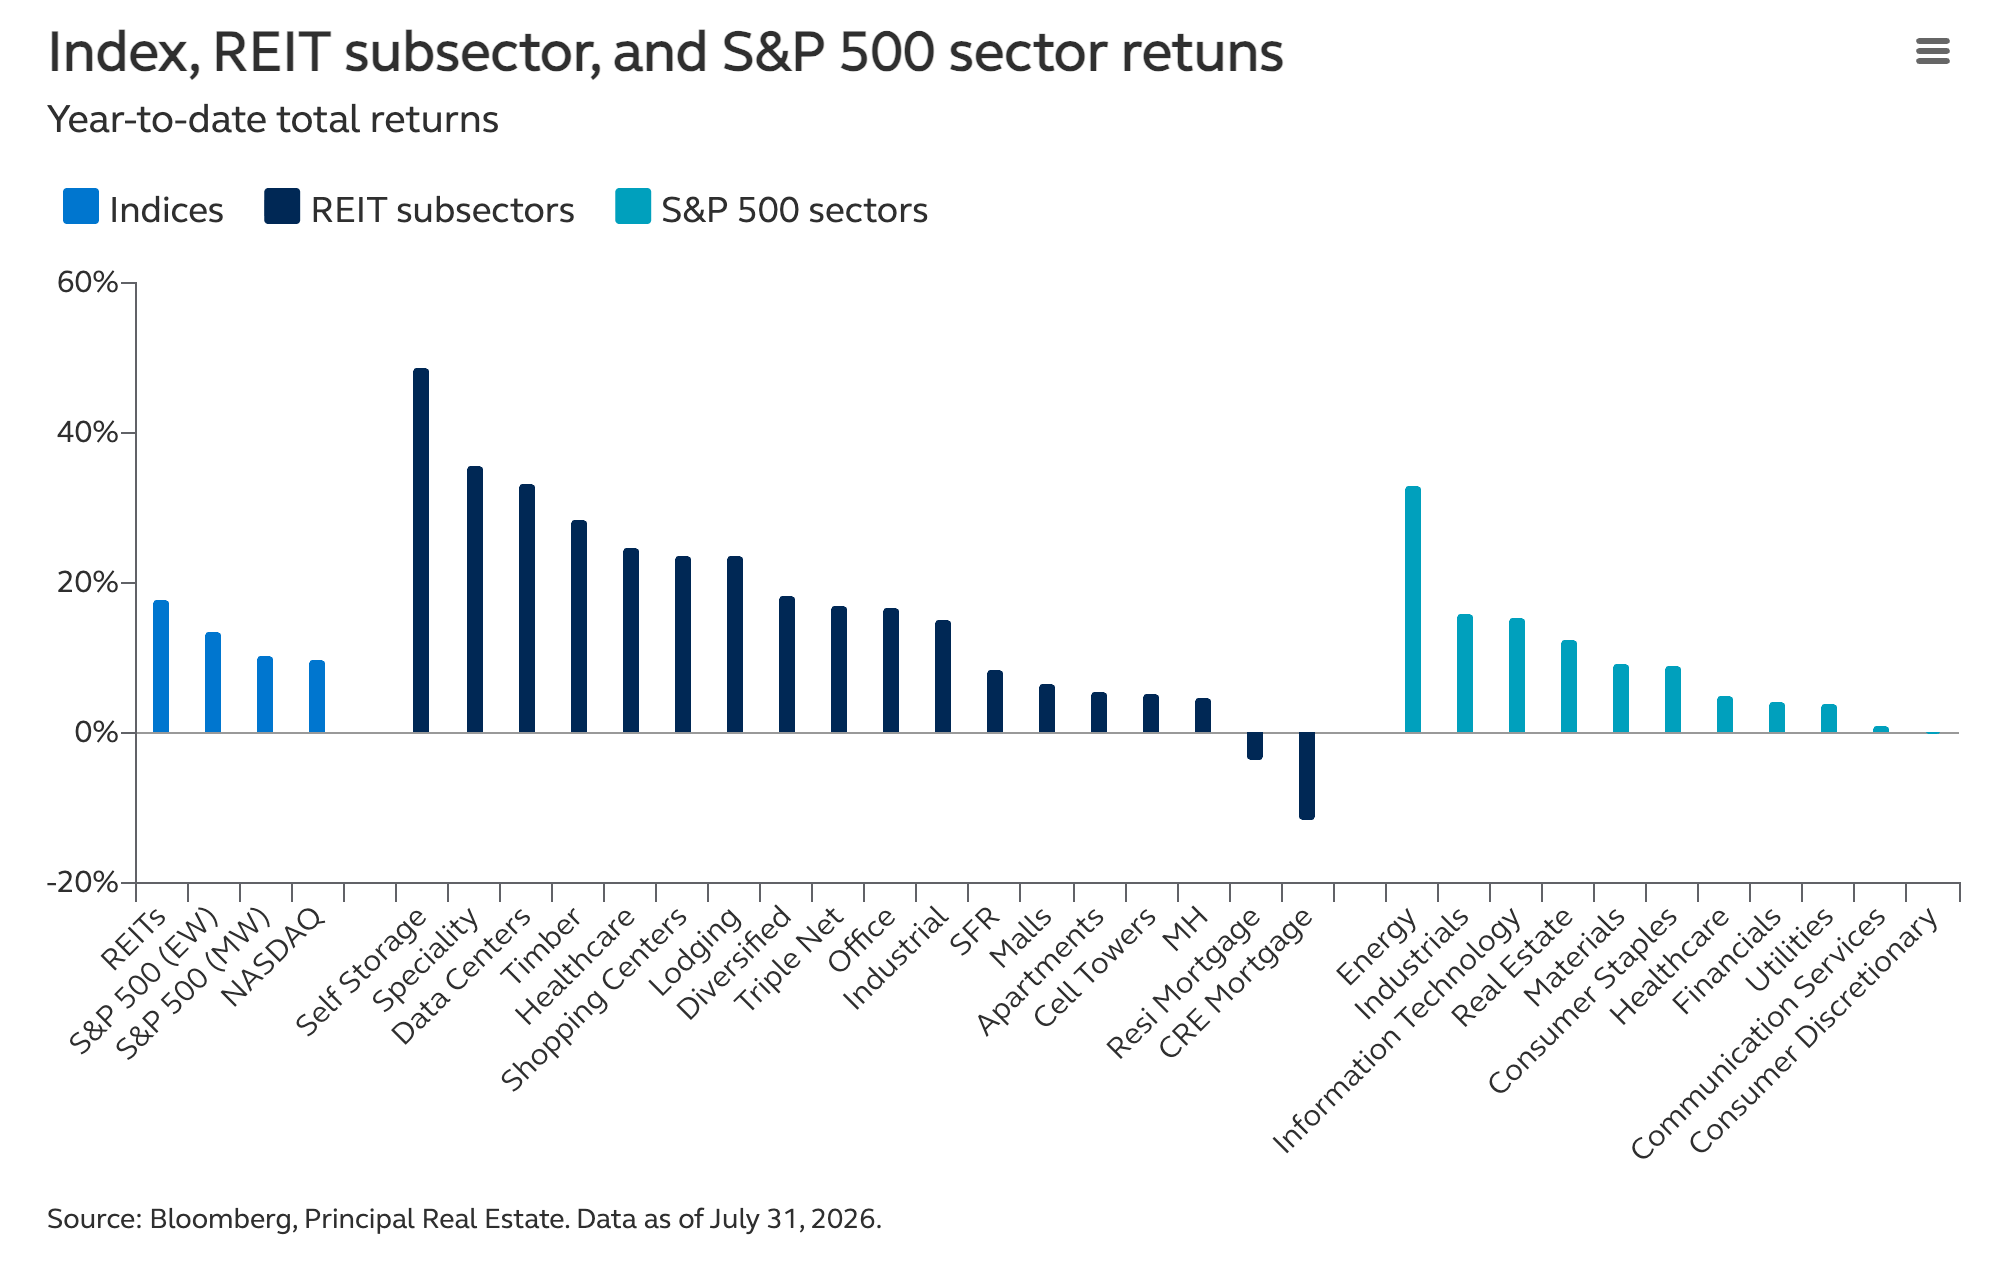
Our prior analysis showed that U.S. CRE cycles typically span roughly 16 years, progressing through recovery (~2 years), expansion (11–12 years on average), and downturn (~1.5 years) phases. They are supported by both price returns and underappreciated income returns, the latter of which becomes increasingly important in higher interest rate environments. Indeed, U.S.-listed REITs, our leading indicator, continue to signal resilience, with year-to-date total returns of almost +18% (even after giving back -2.4% in the last week of July as rates spiked), and the sector remains firmly in expansion territory. Real estate is the 4th-best of the 11 S&P 500 sectors. We think this is because the sector offers predictable earnings and income-driven returns underpinned by contractual leases.
 |
 |
Investor implications
A 10-year Treasury yield approaching 5% undoubtedly raises the hurdle for CRE, particularly if higher yields increasingly reflect inflation concerns rather than stronger real growth. But the implications are not uniform. In our view, this environment reinforces the themes already shaping the current cycle—NOI growth and selectivity. While higher discount rates may delay price discovery and pressure weaker assets, they are unlikely to derail the broader expansion phase so long as property fundamentals remain intact. The key focus for investors should be less about the direction of rates and more on identifying the property types, markets, and vehicles capable of generating durable cash flow growth.
Important Information:
Past performance does not guarantee future results. Investing involves risk, including possible loss of principal. Index performance information reflects no deduction for fees, expenses, or taxes. Indices are unmanaged and individuals cannot invest directly in an index.
Equity investments involve greater risk, including higher volatility, than fixed-income investments. Fixed-income investments are subject to interest rate risk; as interest rates rise their value will decline. International and global investing involves greater risks such as currency fluctuations, political/social instability and differing accounting standards. Real estate investment options are subject to risks associated with credit, liquidity, interest rate fluctuation, adverse general and local economic conditions, and decreases in real estate values and occupancy rates. Commodity futures contracts generally are volatile and not appropriate for all investors.
This report contains general information only and does not take account of any investor's investment objectives or financial situation and should not be construed as specific investment advice, a recommendation, or be relied on in any way as a guarantee, promise, forecast or prediction of future events regarding any particular asset allocation, investment product, overall investment strategy, or the markets in general. The information presented has been derived from sources believed to be accurate; however, we do not independently verify or guarantee its accuracy or validity.
Any reference to a specific investment or security does not constitute a recommendation or buy, sell, or hold such investment or security, nor an indication that Principal Global Investors or its affiliates has recommended a specific security for any client. The information contained in this report should not be relied upon as a primary basis for an investment decision and an investment decision based on this report may result in a loss.
The subject matter in this communication is provided with the understanding that Principal® is not rendering legal, accounting, or tax advice. You should consult with appropriate counsel or other advisors on all matters pertaining to legal, tax, or accounting obligations and requirements.
©2026 Principal Financial Services, Inc., Principal®, Principal Financial Group®, Principal Asset Management, and Principal and the logomark design are registered trademarks and service marks of Principal Financial Services, Inc., a Principal Financial Group company, in various countries around the world and may be used only with the permission of Principal Financial Services, Inc.
Principal Asset Management(sm) is a trade name of Principal Global Investors, LLC. Principal Asset Management is the global investment management business for Principal Financial Group®.
This information was created and prepared by Clearnomics, Inc. Clearnomics is not affiliated with Principal Financial Group® or any if it's member companies.
4299248